
Interest rate futures are contracts where debt instruments, like bonds or eurodollars, serve as the underlying asset.
Debt securities, such as United States Treasury notes and Bonds, are issued by entities to raise funds. In this context, the issuer acts as the borrower, while the buyer (or holder) of the debt security functions as a lender, expecting to earn interest and have the principal repaid when the security matures.
The issuer of a debt security typically makes fixed-dollar interest payments to the holders at specified intervals until the debt matures. Debt issuers can include the federal government, municipal governments, and corporations.
When someone buys a U.S. Treasury security, they are essentially lending money to the U.S. government. In return, the buyer receives semiannual interest payments from the government. Upon maturity of the bill, note, or bond, the holder is repaid the par value of $1,000 by the government as the principal. Interest rate futures contracts are based on U.S. Treasury debt instruments, such as bonds, T-bills, and notes, serving as the underlying asset.

Market value and face value
The buyer of a debt security has the option to hold it until maturity or sell it at any time before then. The market price of bonds traded in the cash market can fluctuate above, below, or at par value, depending on various factors. The most significant factor influencing a bond’s market price is the relationship between its stated interest rate, or coupon rate, and current interest rates.
Bond prices and interest rates have an inverse relationship, meaning that when interest rates change, bond prices move in the opposite direction. If interest rates decrease, bond prices increase; conversely, if interest rates rise, bond prices decline. This makes the market value of all bonds susceptible to interest rate risk.
Treasury bills, notes, and bonds are supported by the full faith and credit of the U.S. government, which has the authority to raise taxes and create money. T-bonds are highly liquid and can be easily converted to cash. However, their market prices fluctuate with changes in overall interest rates, making them sensitive to interest rate movements.
Looking to grow your wealth?
Let me help you make your money work for you
Managed Investment Accounts – harness the expertise of professional asset management. I’ll focus on growing your wealth, so you can focus on living your best life.
Automated Trading System – effortlessly grow your capital with our automated trading solutions
Yield curves

Normal (positive) yield curve
The yield curve represents the relationship between bond yields and their maturities. Typically, short-term debt has lower yields, while long-term debt has higher yields, creating a normal (positive) yield curve with an upward slope when plotted on a graph. The normal yield curve, as shown in the figure above, depicts the yield relationship for U.S. government debt securities, ranging from one-year T-bills at 1% to 30-year T-bonds at 5%.
As mentioned, the normal yield curve has an upward slope due to risk considerations: shorter maturities are less volatile and, therefore, safer, while longer maturities are more volatile and riskier. Investors typically demand higher returns for taking on the increased risk associated with longer-term investments.

Inverted (negative) yield curve
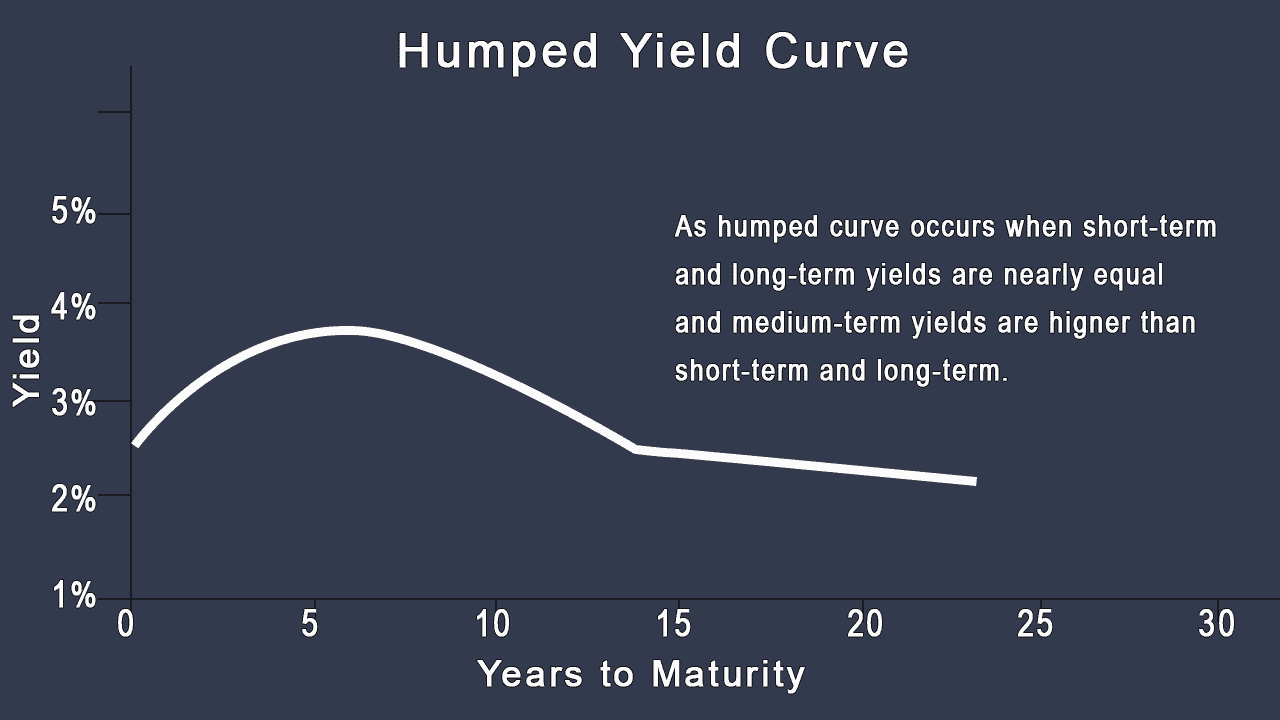
Yield curve summary
Positive. Long-term rates greater than short-term rates
Negative. Long-term rates less than short-term rates
Flat. Long-term rates and short-term rates about the same
Humped. Short-term and long-term yields are nearly equal, and medium-term yields are higher.
Other Price-Yield Considerations
Interest rate futures contracts
- contracts on short-term debt obligations,
- contracts on long-term debt obligations.
The futures contracts for short- and long-term debt have many similarities.
Short-term debt obligations
Futures contracts on short-term debt obligations, such as T-bill and eurodollar futures, share the following characteristics:
- have contract sizes based on $1 million par values;
- have three-month maturities;
- are priced at the discount and mature at par (100%); and
- reflect that the underlying commodity is a discount debt obligation.
Long-term debt obligations
Futures contracts on long-term debt obligations, such as T-bonds and T-notes, have the following features:
- have $100 000 par values;
- are treated ad having 6% coupon rates; and
- have delivery months of March, June, September, and December.
Delivery of futures on long-term debt obligation contracts can be made with qualified securities of different coupon rates. In the case of T-bonds or T-notes, the settlement price at delivery depends on the coupon rate on the bonds and adjustment factor. The amount that the long futures holder would have to pay (excluding accrued interest) is calculated as follows:
Contract settlement price X adjustment factor = amount
The adjustment factors for various deliverable Treasury issues are published by the CME using CBOT rules.
Long-term contracts are typically quoted as a percentage of par, with a tick size of 1/32 of a point or a fraction thereof. Each full point, representing 1% of the par value of the contract (1-00, or 1.00) equals $1 000. Each tick (1/32, -01 or.01) equals $31.25 change in the cash value of the contract.
T-bond futures
T-bond futures are contracts based on the longest maturity U.S. government debt obligations. To qualify for delivery, the securities must have at least 15 years remaining until maturity or the first call date. Delivery is made by depositing the appropriate amount of T-bonds in any Federal Reserve System bank for wire transfer via the Federal Reserve wire. T-bond futures are among the most actively traded futures contracts available.
T-note futures
T-note futures are contracts based on intermediate-term U.S. government debt. To qualify for delivery, the Treasury securities must have between 6½ and 10 years remaining until their maturity or first call date. The delivery process is the same as for T-bond futures, involving the deposit of the appropriate T-notes in any Federal Reserve System bank for wire transfer via the Federal Reserve wire.
| Exchange | $ | Futures | Tick |
|---|---|---|---|
| CME | $1 000 000 | T-bills, Eurodollar | .005 = $12.50 |
| CME/CBOT | $100 000 | T-notes, T-bonds | 1/2 of 1/32 = $15.625 |
Intermaturity spreads
When using intermaturity spreads, such as buying T-bill futures while selling T-bond futures, it’s important to account for the greater volatility of long-term bond prices compared to bond yields. Although it might seem unusual to buy T-bill futures and sell T-bond futures, it is a valid strategy for creating an intermaturity spread.
To implement a dollar-weighted hedge, an investor might sell one T-bill futures contract (with a $1 million par value) and buy 10 T-bond futures contracts (each with a $100,000 par value, totaling $1 million par value). With this spread weighting, if both long-term and short-term interest rates change by approximately the same amount, the price of the longer-term T-bond position will typically experience a larger change due to its greater price volatility.
Wishing you a great week!
Want Your Money To Grow?
Subscribe to get free research, trading lessons, and more insights.
(We do not share your data with anybody, and only use it for its intended purpose)


